



 All Products
Industrial and Huge installations License




We are in BETA mode, some features might not work properly but we are fixing it.
Utility-scale plants. Full single-line diagram. Every feature enabled.
SunGrid Portal Industrial is the top tier: the complete platform with nothing gated. It is built for MW-class PV and storage plants, EPCs and asset managers — the operators who need a real single-line diagram, an engineering-grade topology editor that the rest of the system reads from, a fleet map across every site, and a queryable audit trail they can hand to a regulator. Self-hosted, on infrastructure you own.
No vendor cloud. No per-MW SaaS fee. No plant data in someone else's jurisdiction.
What Industrial unlocks
Industrial single-line diagram — the plant, drawn properly
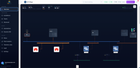
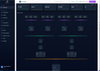
A live SLD rendered from your real topology, top to bottom: PV array cards grouped per DC bus, HV/LV DC bus bars, inverter banks aligned to the buses that feed them, the LV AC bus, then the full transmission chain — transformers, switchgear, disconnectors, bus couplers, parallel branches, the MV AC bus — down to a point-of-interconnection hero card. Column ordering is computed so connector lines never cross, and power flows as animated photons along the real electrical path.
Switching state is live, not decorative: contactors and disconnectors take their open/closed state from the actual switch device, and an open switch stops the flow downstream — on the diagram and in every derived number. Transformers without their own metering inherit the upstream bus, with current and power split across closed branches. Plant KPI tiles sit on top: total generation, plant load, availability, grid import/export, aggregate battery SoC and active alerts, each with a sparkline.
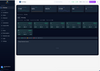
Drill into any array for a string-level heatmap that scores each string's performance ratio against the PVGIS irradiance forecast for that hour — underperforming strings surface before anyone walks the field. BESS containers expand into their own hierarchy, down to rack and module level.
System Design — the topology editor everything else reads from
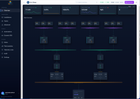
A schematic editor on an infinite canvas with proper IEC symbols and a palette of nearly thirty element types: PV arrays, combiner boxes, DC-coupled MPPTs, string inverters, PCS, BESS containers, batteries, transformers, switchgear, disconnectors, breakers, bus couplers, capacitor banks, gensets, ATS, meters, shunts, PLCs, RS-485 readers, smart loggers, weather stations, grid and consumer nodes. Buses are typed by voltage class — LV DC, LV AC, MV AC, HV AC, HV DC — and electrical islands are detected automatically.
Every element is bound to live data: a Modbus register, an MQTT topic, a PVGIS metric, a static value, or a computed expression combining them. That single design is then the source of truth for the SLD, the dashboards and the derived plant metrics — you draw the plant once.
A built-in design rule check flags unconnected storage, floating nodes, inverters with no AC output or no input, and AC/DC port mismatches before they become a wrong number on a screen. Designs are versioned: snapshot, compare, restore any previous revision, prune the history, and export or import the whole thing as JSON to move a plant between instances.
Design-driven dashboards
Turn the design itself into the dashboard. Three drill-down layers — plant overview, electrical island, individual inverter — with live hover cards on every element and direct switching control on couplers bound to Tuya, Sonoff or Shelly devices, locally or over the cloud.
Installations — the whole portfolio on one map
Every site as a marker on a real map, with a fleet aggregate bar across all of them: total PV power split between AC-coupled and MPPT production, total consumption with grid import and export, aggregate state of charge with charge/discharge direction, total installed storage against capacity, and cumulative imported/exported energy — always qualified by how many sites are actually online. Per-site status cards, per-portal metric rows, solar production forecasts, a settings drawer to edit any location in place, and a one-click remote console into the site gateway.
Audit log viewer — the trail becomes queryable
Every state-changing API call across every service is recorded on all tiers. Industrial unlocks the interface that lets you use it: filter by time range, event type, severity, actor, site or gateway, free-text search across summary, actor and source service, then open any event to see its decrypted actor IP, user agent and full request detail. Export the filtered set as CSV or JSON — and the export itself is logged as an audit event. Retention is yours to configure.
Installer access delegation
Grant a subcontractor access to a specific site's gateway, and revoke it the day the job ends — per location, from the portal, with every grant and revocation written to the audit trail.
Everything from Commercial, included
Advanced dashboard mode
A technical power-flow schematic that aggregates every gateway at a site into one picture: grid metrics combined across gateways, AC output summed across shared portals, and all battery banks, solar chargers, PV inverters and EV chargers merged into unified blocks — no per-device tabs to click through.
Teams, installation groups and on-call escalation
Teams with per-member skill tags, sites bundled into groups, and a real on-call schedule — team or individual blocks on a timeline, repeat intervals for rotations, coverage windows by weekday and hour, individual blocks overriding team blocks. A team block puts the whole team on-call and the first acknowledgement stops escalation for everyone. A server-side scanner sweeps every 60 seconds and escalates any incident unacknowledged for more than 15 minutes through five levels, notifying each new owner.
Fleet analytics and the PDF service report
Attention board (overdue tasks, open incidents, maintenance gaps, expiring credentials), flow and SLA with MTTR / median time-to-resolve / MTTA, workload per assignee, on-call coverage including the sites covered by nobody, telemetry rule health, activity heatmap and attachment storage. Exportable as CSV or as a branded landscape A4 fleet report PDF with full ticket detail and embedded photos. Every aggregation is scoped to what the caller is allowed to see.
The platform underneath
Live monitoring and custom dashboards
Real-time power flow streamed over a persistent WebSocket with sub-second updates, plus a full widget builder — time-series charts, correlation plots, live-value cards, filtered status lists — bound to any metric in the plant. Describe a widget in plain language and let the AI assistant build it.
Visual automations — no code
Drag-and-drop rule builder: sensor nodes, threshold conditions with hysteresis (no relay flapping), clock and timer gates, latches, and full boolean logic (AND, OR, XOR, NOT, NAND, NOR, XNOR). Actions on inverters, Tuya devices and Sonoff switches. Dry-run any rule before arming it. Safe-state behaviour, crash recovery, automatic retry with verification, and versioned backup/restore.
Dynamic ESS — battery optimisation against your real tariff
A forecast-driven scheduler that plans each battery hour by hour. Tariff calendars with seasons, separate weekday / Saturday / Sunday dials and peak / standard / off-peak pricing, in the plant's own timezone and currency. Strategies: self-consumption, solar export, or full ESS. The optimiser drives charge and discharge through operating mode and state-of-charge thresholds and reads every write back to confirm the device accepted it. Inverter settings are snapshotted before activation and restored automatically on disable.
Telemetry rules, tickets and alerting
Watch any metric and auto-open a maintenance, inspection, incident, observation or task ticket when it crosses a threshold — numeric, text, changed, or stale-data detection, with templated titles and bodies and deduplication so one rule owns one open ticket. Alerts on grid up/down, SoC limits, battery over-temperature, generator start/stop, inverter state changes, BMS limit changes, device alarms, gateway disconnects and escalations — delivered in-app with full history plus email, WhatsApp, Telegram, Discord and Microsoft Teams, routed per event type and per user.
Solar forecasting
Hourly irradiation and PV-production forecasts from the EU PVGIS dataset, computed per string using real azimuth and tilt — the same forecast the string heatmap grades your arrays against.
An AI assistant that knows your plant
Ask in Romanian, English or German. It reads your live topics and metric catalog, streams answers token by token, and shows every tool it calls. Anything that would change device state stops at a confirmation card first — the AI never actuates without an explicit yes.
Hardware and protocols
Victron Cerbo GX over MQTT. Modbus over TCP, RTU, RTU-over-TCP and Solarman — with presets for Huawei SUN2000, Fronius GEN24, Atess HPS, Deye, Solis and WAGO, and an importer for your own register maps, including FC03/FC04 input registers and writable setpoints. Tuya smart devices over cloud or pure LAN. Sonoff / eWeLink switches.
Mobile app and languages
Native Android and iOS app for the field — dashboard, tickets, automations, telemetry rules, fleet analytics, audit and Dynamic ESS — paired with a one-time token, no third-party account. Full Romanian, English and German throughout, including notification text.
Security — engineered in, not bolted on
-
FIPS 140-3 validated cryptography. Production images are compiled against validated cryptographic modules (Go with
GOFIPS140andfips140=on; Node built against an OpenSSL FIPS module). Every service exposes a live/fipszendpoint so you can verify it yourself, at runtime, on your own infrastructure — and show it to an auditor. - Encrypted at rest, everywhere it matters. AES-256-GCM envelope encryption with a versioned keyring and key rotation covers device credentials, user PII, audit fields, energy-storage policies, GPS coordinates and cached payloads. Ciphertext is bound to its context, so a stolen blob cannot be replayed into a different column.
- Mutual TLS between every component. Services authenticate each other with client certificates — including connections to PostgreSQL, Redis and the metrics store. Internal APIs fail closed.
- Modern authentication. WebAuthn / FIDO2 passkeys for passwordless login, TOTP authenticator 2FA, email 2FA, short-lived JWTs with refresh-token rotation and reuse detection, per-device session tracking with remote revocation, rate limiting, account lockout, and a login path hardened against user-enumeration timing attacks.
- Role-based access with per-site scoping. Admin, installer and user roles; a technician sees only the plants assigned to them, enforced in every aggregation and on every route server-side — not hidden client-side.
- A complete, queryable audit trail. Every state-changing call across every service, with encrypted actor IP, user agent and request detail, configurable retention, and the viewer and export tooling included at this tier.
- Hardened, minimal images. Distroless production containers built from source, cryptographically signed, and continuously scanned for CVEs.
Data sovereignty — the part nobody else will put in writing
Your plant data never leaves your network.
Every reading from every inverter, every string, every battery cycle, every MWh imported or exported is written to a PostgreSQL and Prometheus instance running on your machine, on your infrastructure. There is no ingest pipeline to a vendor cloud, because there is no vendor cloud. When an asset owner, a grid operator or a regulator asks where the production data lives and who can reach it, the answer is a server you control and an audit log you can query.
The only mandatory outbound call is the licence heartbeat, and it carries a hardware fingerprint, hostname, platform, hardware specs, public IP, software version and container image digests — no telemetry, no energy data, no personal data, no ticket contents. The licence token is valid for 24 hours and cached locally encrypted, so an internet outage never stops the plant. Solar forecasting sends coordinates only, weather sends a location, and both can be switched off. Notification channels carry only the alerts you configured. Tuya and Sonoff clouds are touched only if you choose cloud devices — LAN mode is available.
AI that stays home. The assistant ships configured for local inference — Ollama or LM Studio on your own hardware. Your prompts, your metric names, your plant topology never touch a third-party model. Cloud providers (Gemini, Claude) are available if you choose them, and never enabled by default.
No lock-in. Full configuration export and import, plant designs exportable as JSON. It is your PostgreSQL database — dump it, back it up, move it to a new machine, hand an asset owner their own instance, walk away with everything. Nothing is held hostage in someone else's account.
Included in the Industrial licence
Everything. No feature in the platform is gated at this tier.
- ✔ Industrial single-line diagram — PV arrays, DC buses, inverter banks, transformers, MV bus, point of interconnection, live switching state
- ✔ Plant KPI tiles and string-level performance heatmap against forecast
- ✔ System Design topology editor — IEC symbols, ~30 element types, live data bindings, design rule checks, versioning, JSON export/import
- ✔ Design-driven drill-down dashboards with coupler switching control
- ✔ Installations map board with fleet-wide aggregate metrics and remote console
- ✔ Audit log viewer with filtering, event detail and CSV/JSON export
- ✔ Installer access delegation per site
- ✔ Advanced dashboard mode — whole-site aggregated power-flow schematic
- ✔ Teams, installation groups, on-call scheduling and automatic escalation
- ✔ Fleet analytics, SLA metrics and branded PDF service report
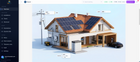
- ✔ Classic dashboard — house / camper / boat, live power flow
- ✔ Custom widget dashboard + AI widget builder
- ✔ Historical charts and energy statistics (90-day high-resolution metrics, long-term history in your database)
- ✔ Solar forecasting (PVGIS) and weather
- ✔ Visual automation builder with simulation, backup and restore
- ✔ Dynamic ESS battery optimisation with full tariff calendar editor
- ✔ Telemetry rules and multi-channel notifications
- ✔ Notes, tickets and incident tracking with attachments
- ✔ AI assistant (local-first)
- ✔ MQTT, Modbus, Tuya and Sonoff integrations with custom register-map import
- ✔ Unlimited plants, users, roles and per-site access scoping
- ✔ Android + iOS mobile app
- ✔ Romanian / English / German
Upgrading from Home or Commercial is a licence change — no reinstall, no data migration. Your new capabilities appear within 30 seconds.
Run the plant like an engineer. Own the data like an owner.